Cumulative Flow Diagram [CFD]
Last Updated: June 2026
A Cumulative Flow Diagram is a visual summary of the information contained on the Scrum Wall, Task Board, or Kanban Wall. A Cumulative Flow Diagram differs from a Burnup in that it tracks work through all of its states. It’s useful because it can help spot bottlenecks and trends, but don’t confuse a Cumulative Flow Diagram or other measurement with the real world. A measurement is just a hint to go find out what is really happening.
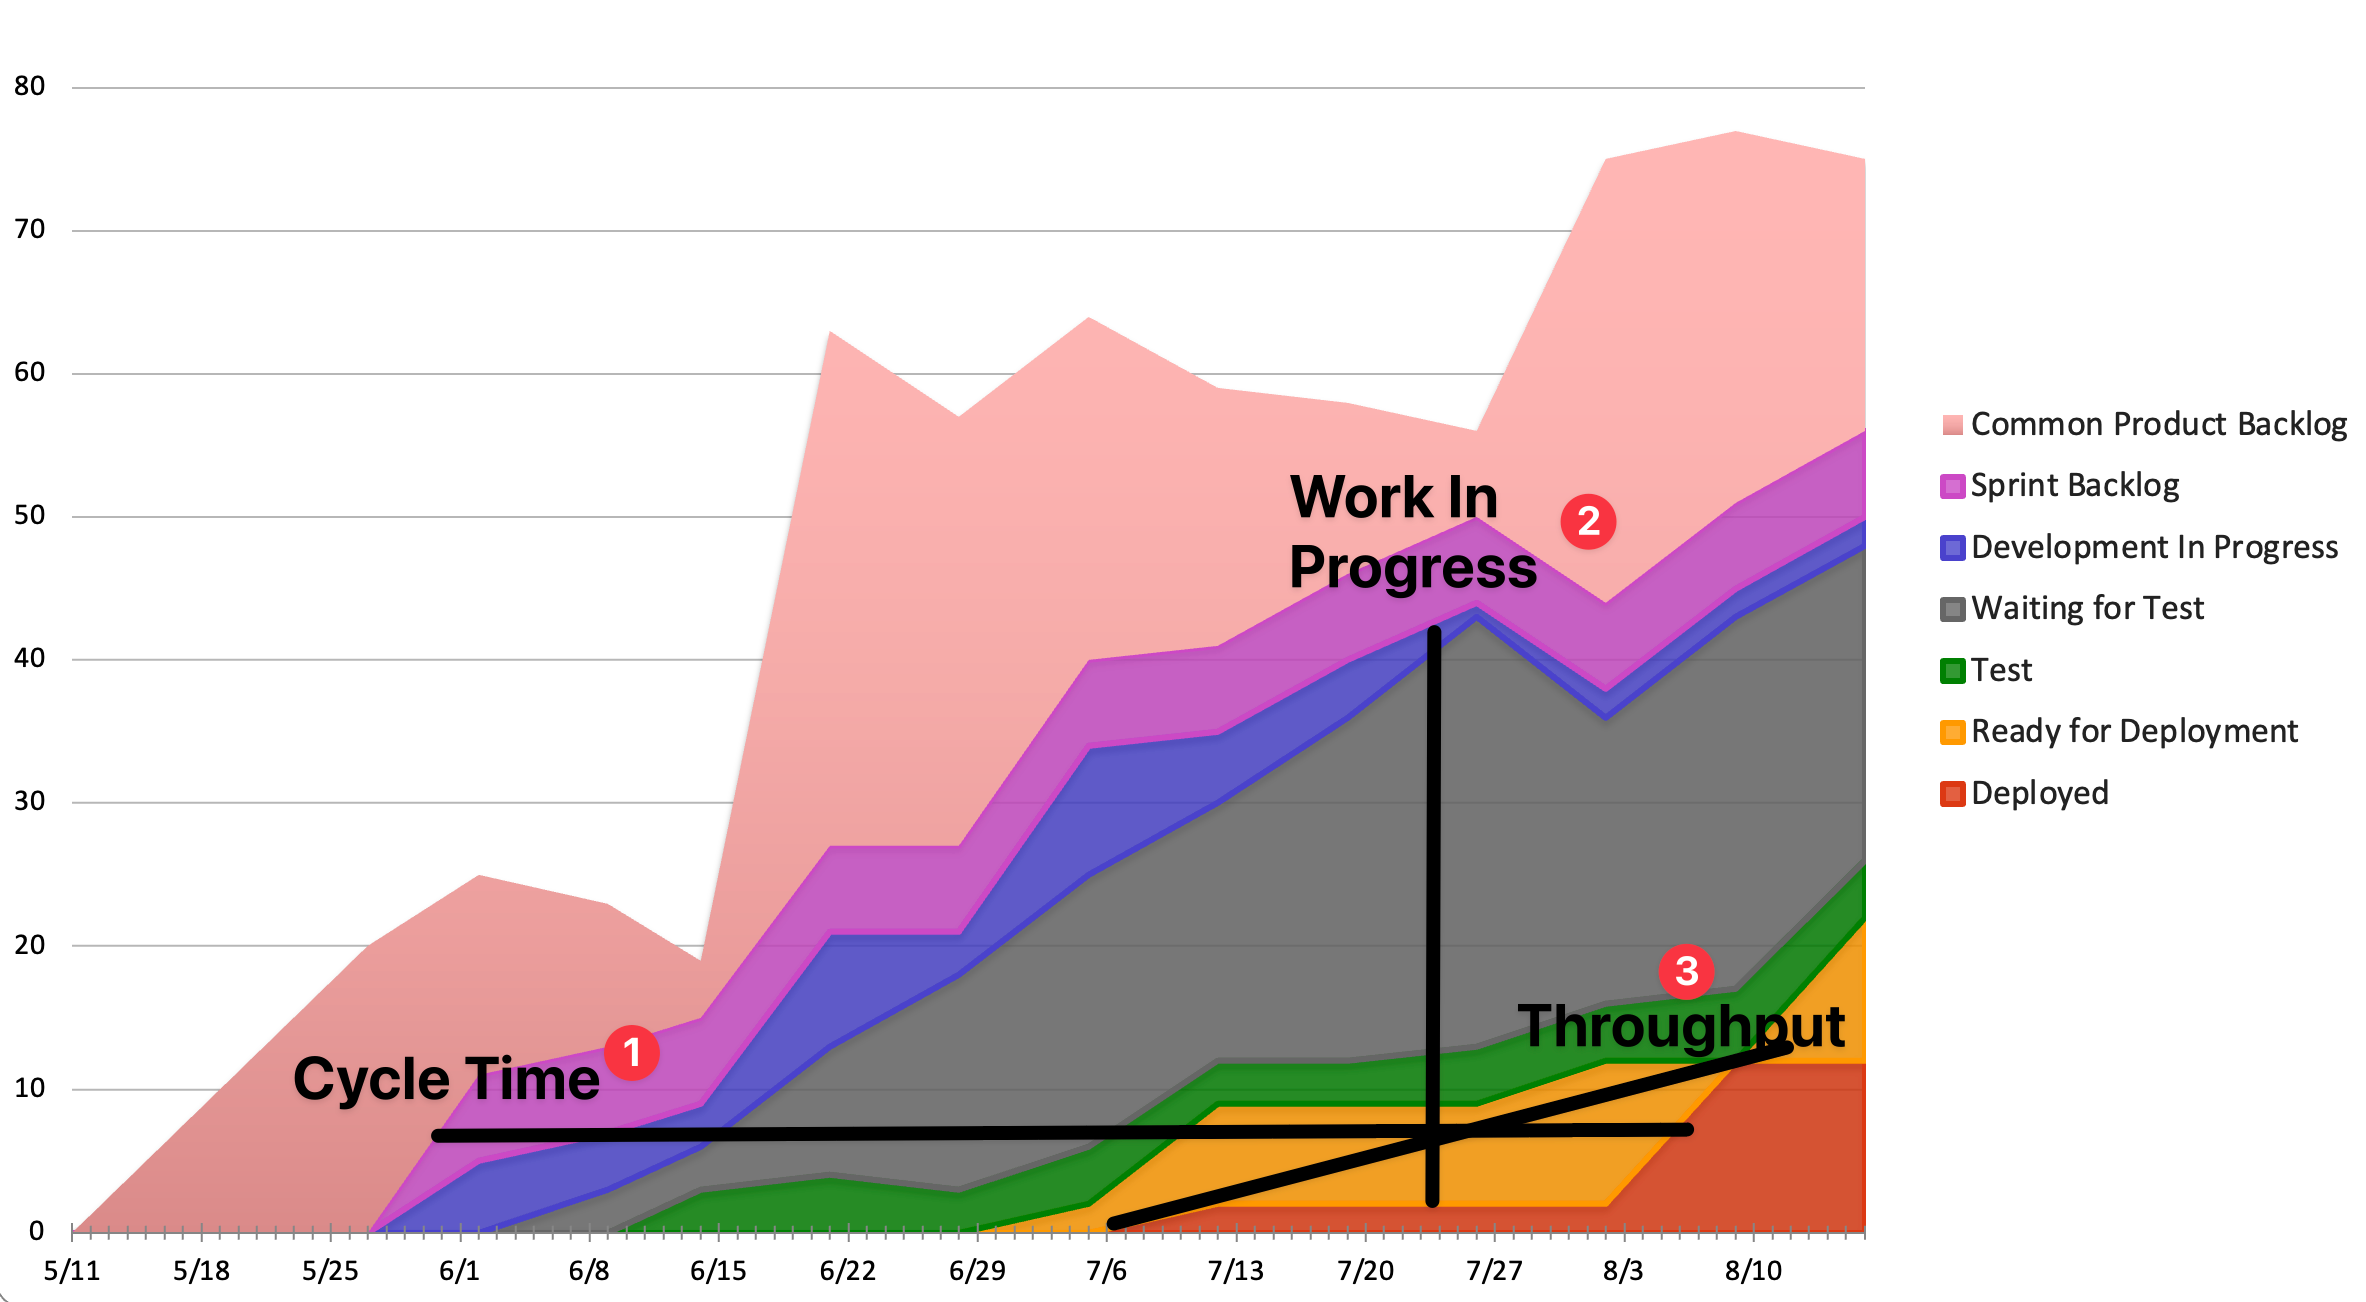
This simple picture allows us to see how many items (Stories/Features/Tasks) are in each state at a given point in time. The horizontal axis is time, and the vertical axis is the number of items. (You could also use Story Points or some other unit of measure - most of the Agile community now thinks that Story Points are a bad idea.)
The height of each layer at a given time is the number of items that are in that state. In this case, from early June through late July, the team is accumulating a number of items that are waiting to be tested. Meanwhile, very few items are either ready for deployment or in production. Instead of pumping out more items, the team should be helping out with the testing.
The graph helps see four measurements:
- Cycle Time - the time it takes for an item to go from “we start working on it” to “value delivered to the customer”.
- Work in Progress - how many items are being worked on at that moment
- Throughput - the rate at which items are getting to the done column.
- Lead Time - (not shown) the time it takes to go from the moment we commit to the customer to the moment we deliver the value.
For how Cumulative Flow Diagrams sit alongside other charts and reports (and where they mislead), see Why Red-Yellow-Green Status Reports Mislead Leaders and Measurement for Scrum - What are Appropriate Measures?.
Resource Links
- Creating Cumulative Flow Diagrams
- Cumulative Flow Diagram
- Cumulative Flow Diagrams - summary from: Actionable Agile Metrics
- Explaining Cumulative Flow Diagrams – CFD
- How to Read the Cumulative Flow Diagram - Infographic
- Why we love metrics? Cumulative flow diagrams - a good story about what one team learned
