Causal Loop Diagram
Last Updated: May 2025
A Causal Loop Diagram is a visual representation and reference that helps to understand cause and effect connections. It works best when people work together to create it, and the collaboration is used to tease out the common understanding of a problem. I like using them with teams to help think about moving beyond the Quick Fix mentality to deeper, more systemic solutions.
You can see examples of CLDs in action in these anti-patterns, where the Causal Loop Diagram makes more obvious the detrimental effect they can have:
Components
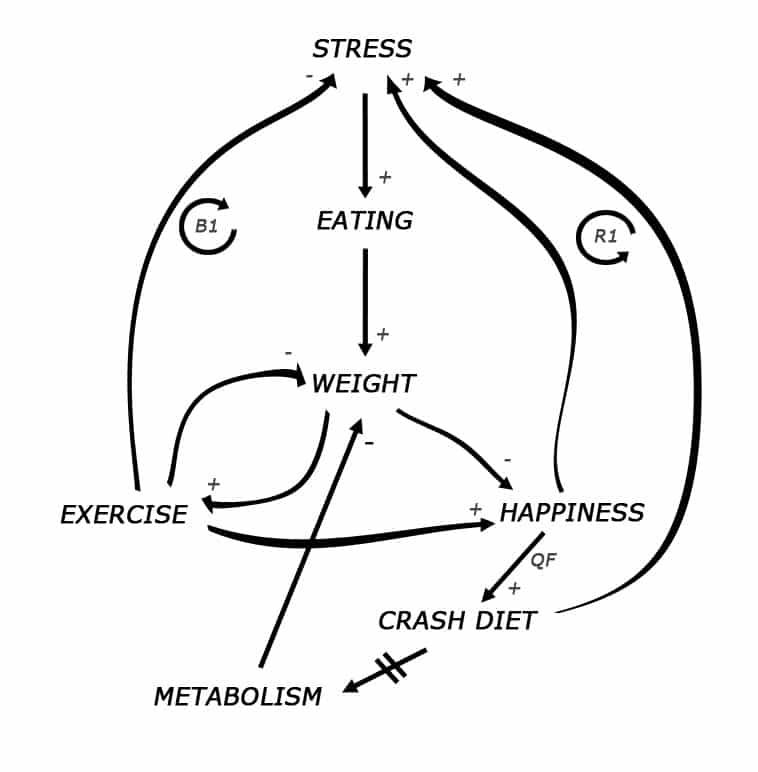
- Variables - the things that are increasing or decreasing (i.e., stress, eating, etc.)
- Arrows - illustrating a relationship between two variables: Stress and Eating
- Plus/Minus signs - indicating whether one variable increases or decreases another): Stress increases Eating; Exercise decreases Weight.
- B and R are often used to illustrate loops. B loops are in balance, and R loops are reinforcing. (Confused - don’t worry, ignore this at first)
Use
- Before making a big change, a CLD can be used to spot unintended consequences.
- When we see a team, organization or system that is dysfunctional CLDs can help reason why.
- Studying bottlenecks, why is this bottleneck recurrent?
- CLDs can also be used to find leverage points.
Agile Pain Relief Blog Entries
We use the diagrams to visualize our antipatterns
- Beyond the Surface: GenAI-Powered Critical Thinking for Deep Team Issues
- Scrum Anti-Patterns: Agile Bonuses The Damage They Do
- Scrum Anti-Patterns: The Hardening Sprint
- Scrum Anti-Patterns: Large Product Backlog
- Scrum Anti-Patterns: Micromanagement
- Agile and Scrum Smells
- AI-Generated Code Quality and the Challenges we all face