Be Better with Better Data
Data and metrics are not synonymous. Let’s tackle that misunderstanding right out of the gate.
Data is a number or set of numbers. “Three days.” There. That’s data. Is it useful to you? Of course not, because you have no context to go with it.
Metrics is the context and measurement of where, and under what conditions from which, that data is the result. Metrics tells you whether three days is how long it took one person (data) to unload a cubic yard (data) of rocks in a rainstorm, or whether it’s how long it took a team of five developers (data) to plan, create, test, and release a product that does X.
We talk about using better data but, really, we should say be better with well-chosen metrics. The problem is that just doesn’t roll off the tongue the same way.
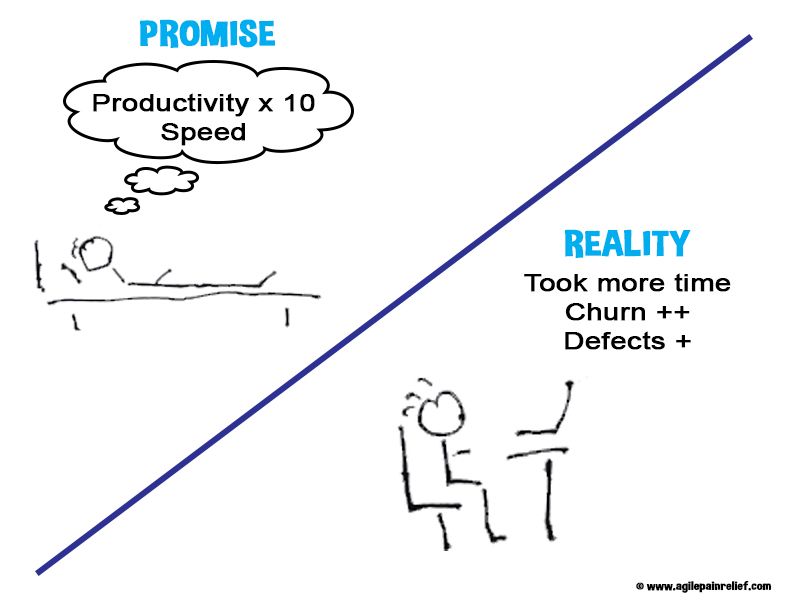
In Scrum, most people instantly think of velocity as the key metric – how much work a team does in a Sprint, usually in the form of number of story points completed. But that’s a weak and easily gamed measure.
“Tell me how you measure me and I will tell you how I behave.” – Eliyahu Goldratt1
How could a team game (i.e. manipulate) this number? The ways are many, but here are just a few:
- They could inflate their numbers during estimation, even without intending to mislead. Someone might say, “Let’s make it 13 or 20, just to be on safe side.” They didn’t purposely inflate the estimate, but that was the outcome.
- Feeling pressure to deliver more Story Points by the end of the Sprint, they might skimp on testing thinking, “Oh, that’s good enough and, in the worst case, we can always fix the bug later.”
- They might argue in Sprint Review that an item is partially complete so they deserve partial credit.
- …
All of these and more are outcomes of Goldratt’s quote. We told the team they were measured with Story Points and they behaved accordingly.
Forewarned is forearmed, and metrics have a good side as well. so they still have a place in Scrum.
Metrics are a tool to help a team know where to focus its energy for improvement next.
Notice that we’ve shifted the focus from measuring productivity to where to focus for improvement. Measurement shouldn’t be individual vs. individual or team vs. team. Rather, it should be team vs. itself in regard to “Where can the team improve next” or “Where has the team improved?”
But when we encourage you to improve, we can hear you cry back, “How do we measure that? Much of it can’t be measured and, when it can, the effects will only appear months after the actions are taken.” Fair point. Good metrics help you spot trends and find problems. Unfortunately, the data might not tell you if the specific change you made had the effect you wanted.
The key problem is that all measures we can find are trailing, and some measure their effect long after the action was taken. An example might help. Suppose our heroic team decides to better their engineering practice with “trunk based development”, their hypothesis is that doing all work on the main branch with daily checkins will reduce the frequency of merge problems and make refactoring easier. In turn, this will reduce code complexity and decrease the number of defects. So our mythical team adopts this improvement, and finds a good measure for code complexity and defects. Yay, team. The problem is that, with a sizeable existing codebase, it will take months for the benefits to prove themselves in a measurable way. In that time our team will likely have tried several other things to make improvements (a wise idea). How do we tell which improvement lead to the change in the measure?
Or if you prefer a non-programming example, think of data like a blood pressure test. High numbers suggest that improvements could be made. So you immediately cut down on salt and coffee. Maybe you take some medication. A few weeks later you book some vacation time and go hiking. Months down the road, you feel much better. What was the “fix”? Diet? Medication? Reduced stress? Exercise? All of the above? None of the above? A combination of some but not others?
In the end, does it really matter? You’re healthier and happier. The measurement data was important because it showed where to look for trouble brewing, but don’t get hung up on using it as the thing that tells you if you were successful.
So the measures we offer here are tools to help your team to understand where it is in pain, but they won’t tell you whether or not you got better.
Start with Throughput
In The Guide to Effective Agile Retrospectives eBook, we mention many sources of data that you could collect for the team. We suggest replacing velocity with a simpler measure like throughput – the number of Product Backlog Items completed in a Sprint. (Note: “completed” means Product Owner accepted and the item met the Definition of Done.) Throughput is elegant because most attempts to game it improve the product we’re building. For example, in an attempt to increase perceived throughput without doing more work, the team split their features or user stories into smaller chunks. When features are split into smaller chunks, there are typically fewer defects since they’re better understood and the product owner gains greater flexibility.
To improve your use of metrics, find a few simple sources of data you could bring to your next retrospective. From the eBook, some highlights:
- The Team calendar – helps to remember who was present and who was away
- Did the team have any Production Support issues to deal with? When did they happen? Were there interruptions from other sources outside the team (e.g. VP or CEO)? When? Capture and display this information on a Kanban wall.
- Items still In Progress at Sprint End
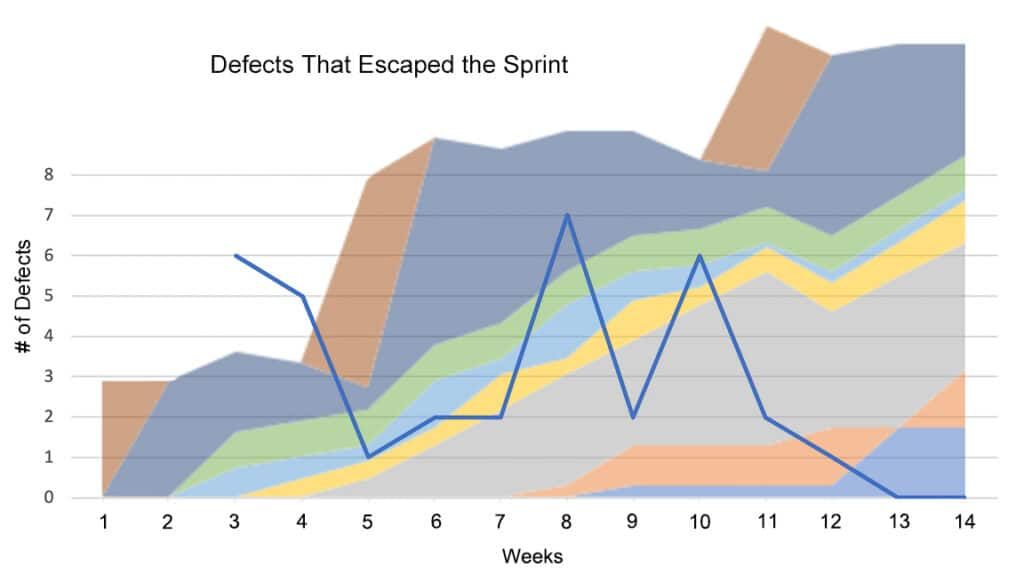
- Number of User Stories that were thought complete but failed to meet the Definition of “Done”
Consider Morale
We all want to create a workplace that we enjoy. We spend the vast majority of our awake adult lives there, so it sucks if it’s something we dread. No matter how good, or bad, it’s normal to have many ideas about how we’d change things if we were the boss for a day. The question is then, how do we measure that?
There’s rising popularity for using the Happiness Index – whether you’re happy at work – but there are many problems with this as a measure. Morale, on the other hand, is robust, less susceptible to mood, and vastly better studied by both Occupational and Military Psychologists:
‘(Team) Morale is the enthusiasm and persistence with which a member of a team engages in the prescribed activities of that group’ (Manning, 1991).
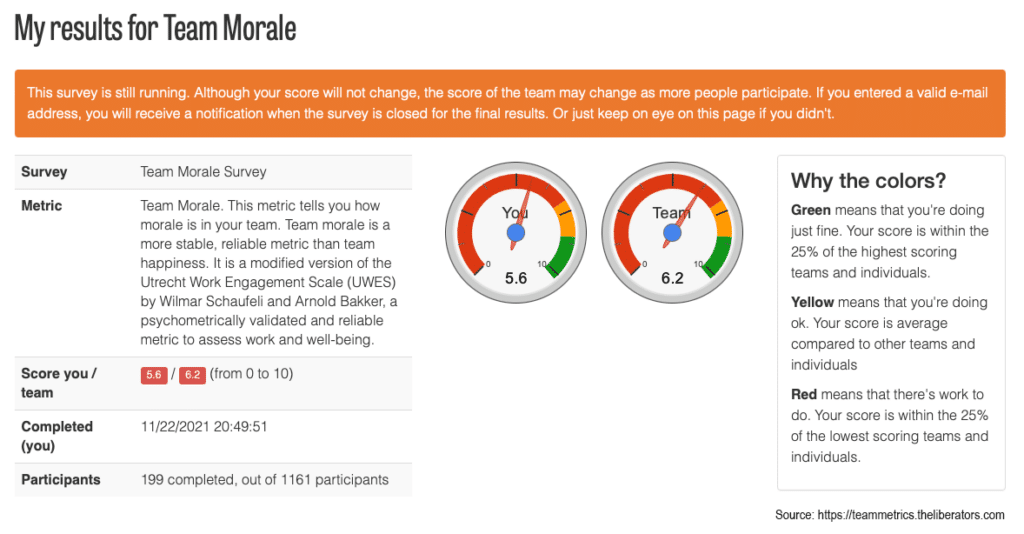
In the Retrospectives book, we shared some summary notes about Christiaan Verwijs’s advice on how to measure morale for a team in a way that more useful than the Happiness Metric. He also a created a free survey tool to help measure morale anonymously across a team: https://teammetrics.theliberators.com
Example Data - Morale

In a retrospective, we could ask questions like:
-
Why is our morale at this level?
-
How does it compare to our historical morale?
-
Can we see if changes in morale correlate with any other measures?
-
Has there been a noticeable downward trend? If so, what has prompted that change?
-
Is there one experiment that might help in improving morale?
Address Impediments and Interruptions
We already know that the ScrumMaster doesn’t solve most impediments on their own and that it’s a team effort. That leaves the bigger issue of creating awareness of the impediments and their sources. There aren’t any miracle cures in this area, but it really helps to gather both quantitative and qualitative data.
Qualitative first – listen in Daily Scrum and make note of problems that your team members encounter. Both the things they describe as impediments, and even the ones that aren’t explicitly named (for example, if a team member says, “I spent half hour waiting for a build to complete or another person to do something for me”). Watch for interruptions from outside the team. Also note incidents of lack of knowledge, which can slow one or more team member as they search for an answer. All of these point to different sources of slowdowns or blockages for your team. A great ScrumMaster will record these and bring the data to a retrospective.
Quantitative – count the number of these impediments, interruptions, or blockages that occur each day. This is also information to bring to the retrospective.
The qualitative data can be used immediately; the quantitative will take a few Sprints until we have enough data that we can show people the correlations. There’s an example in the Retrospective book that shows where, in the Sprints where there are more outside interruptions, the team deliver less value. Take the time to assemble this correlative data, because it can be very powerful at helping to start bigger organizational changes.

Remember, metrics are a tool to help a team know where to focus its energy for improvement. There is no magic, but the closest thing to it can usually be found with teams that make an ongoing effort to consistently make small, positive changes. Something as manageable as a 3% improvement rate will add up to noticeable benefit quicker than you might think. Data, both quantitative and qualitative, can be a source of ideas for those improvements. Or, if the desired improvements are outside of the team’s control, the same data can be used to spark conversation around deeper changes.
Want to have a better understanding of the why and how of more things in Scrum, and not just the book-level what? Practising Scrum without proper understanding can bring poor results and, ultimately, frustration and resistance. In our Certified ScrumMaster workshops, attendees learn in a fun and non-judgmental environment how to make Scrum work effectively in the real world, not just in principle. Join us to learn and to gain practical, hands-on experience.
Image attributions: https://medium.com/the-liberators/agile-teams-dont-use-happiness-metrics-measure-team-morale-3050b339d8af and Agile Pain Relief Consulting (Updated: March 2025)
Footnotes

Mark Levison
Mark Levison has been helping Scrum teams and organizations with Agile, Scrum and Kanban style approaches since 2001. From certified scrum master training to custom Agile courses, he has helped well over 8,000 individuals, earning him respect and top rated reviews as one of the pioneers within the industry, as well as a raft of certifications from the ScrumAlliance. Mark has been a speaker at various Agile Conferences for more than 20 years, and is a published Scrum author with eBooks as well as articles on InfoQ.com, ScrumAlliance.org and AgileAlliance.org.
